I built this molecular analysis toolkit in Rust because I wanted to
move away from the clunky, legacy software often found in structural
biology. The goal was to create a tool that feels more like a modern
game engine, fast, interactive, and fully scriptable. By combining WGPU
for GPU-accelerated rendering with a Lua logic layer, the toolkit
handles real-time visualization alongside complex automated
workflows.
Parallelized
Rendering and Viewport Management
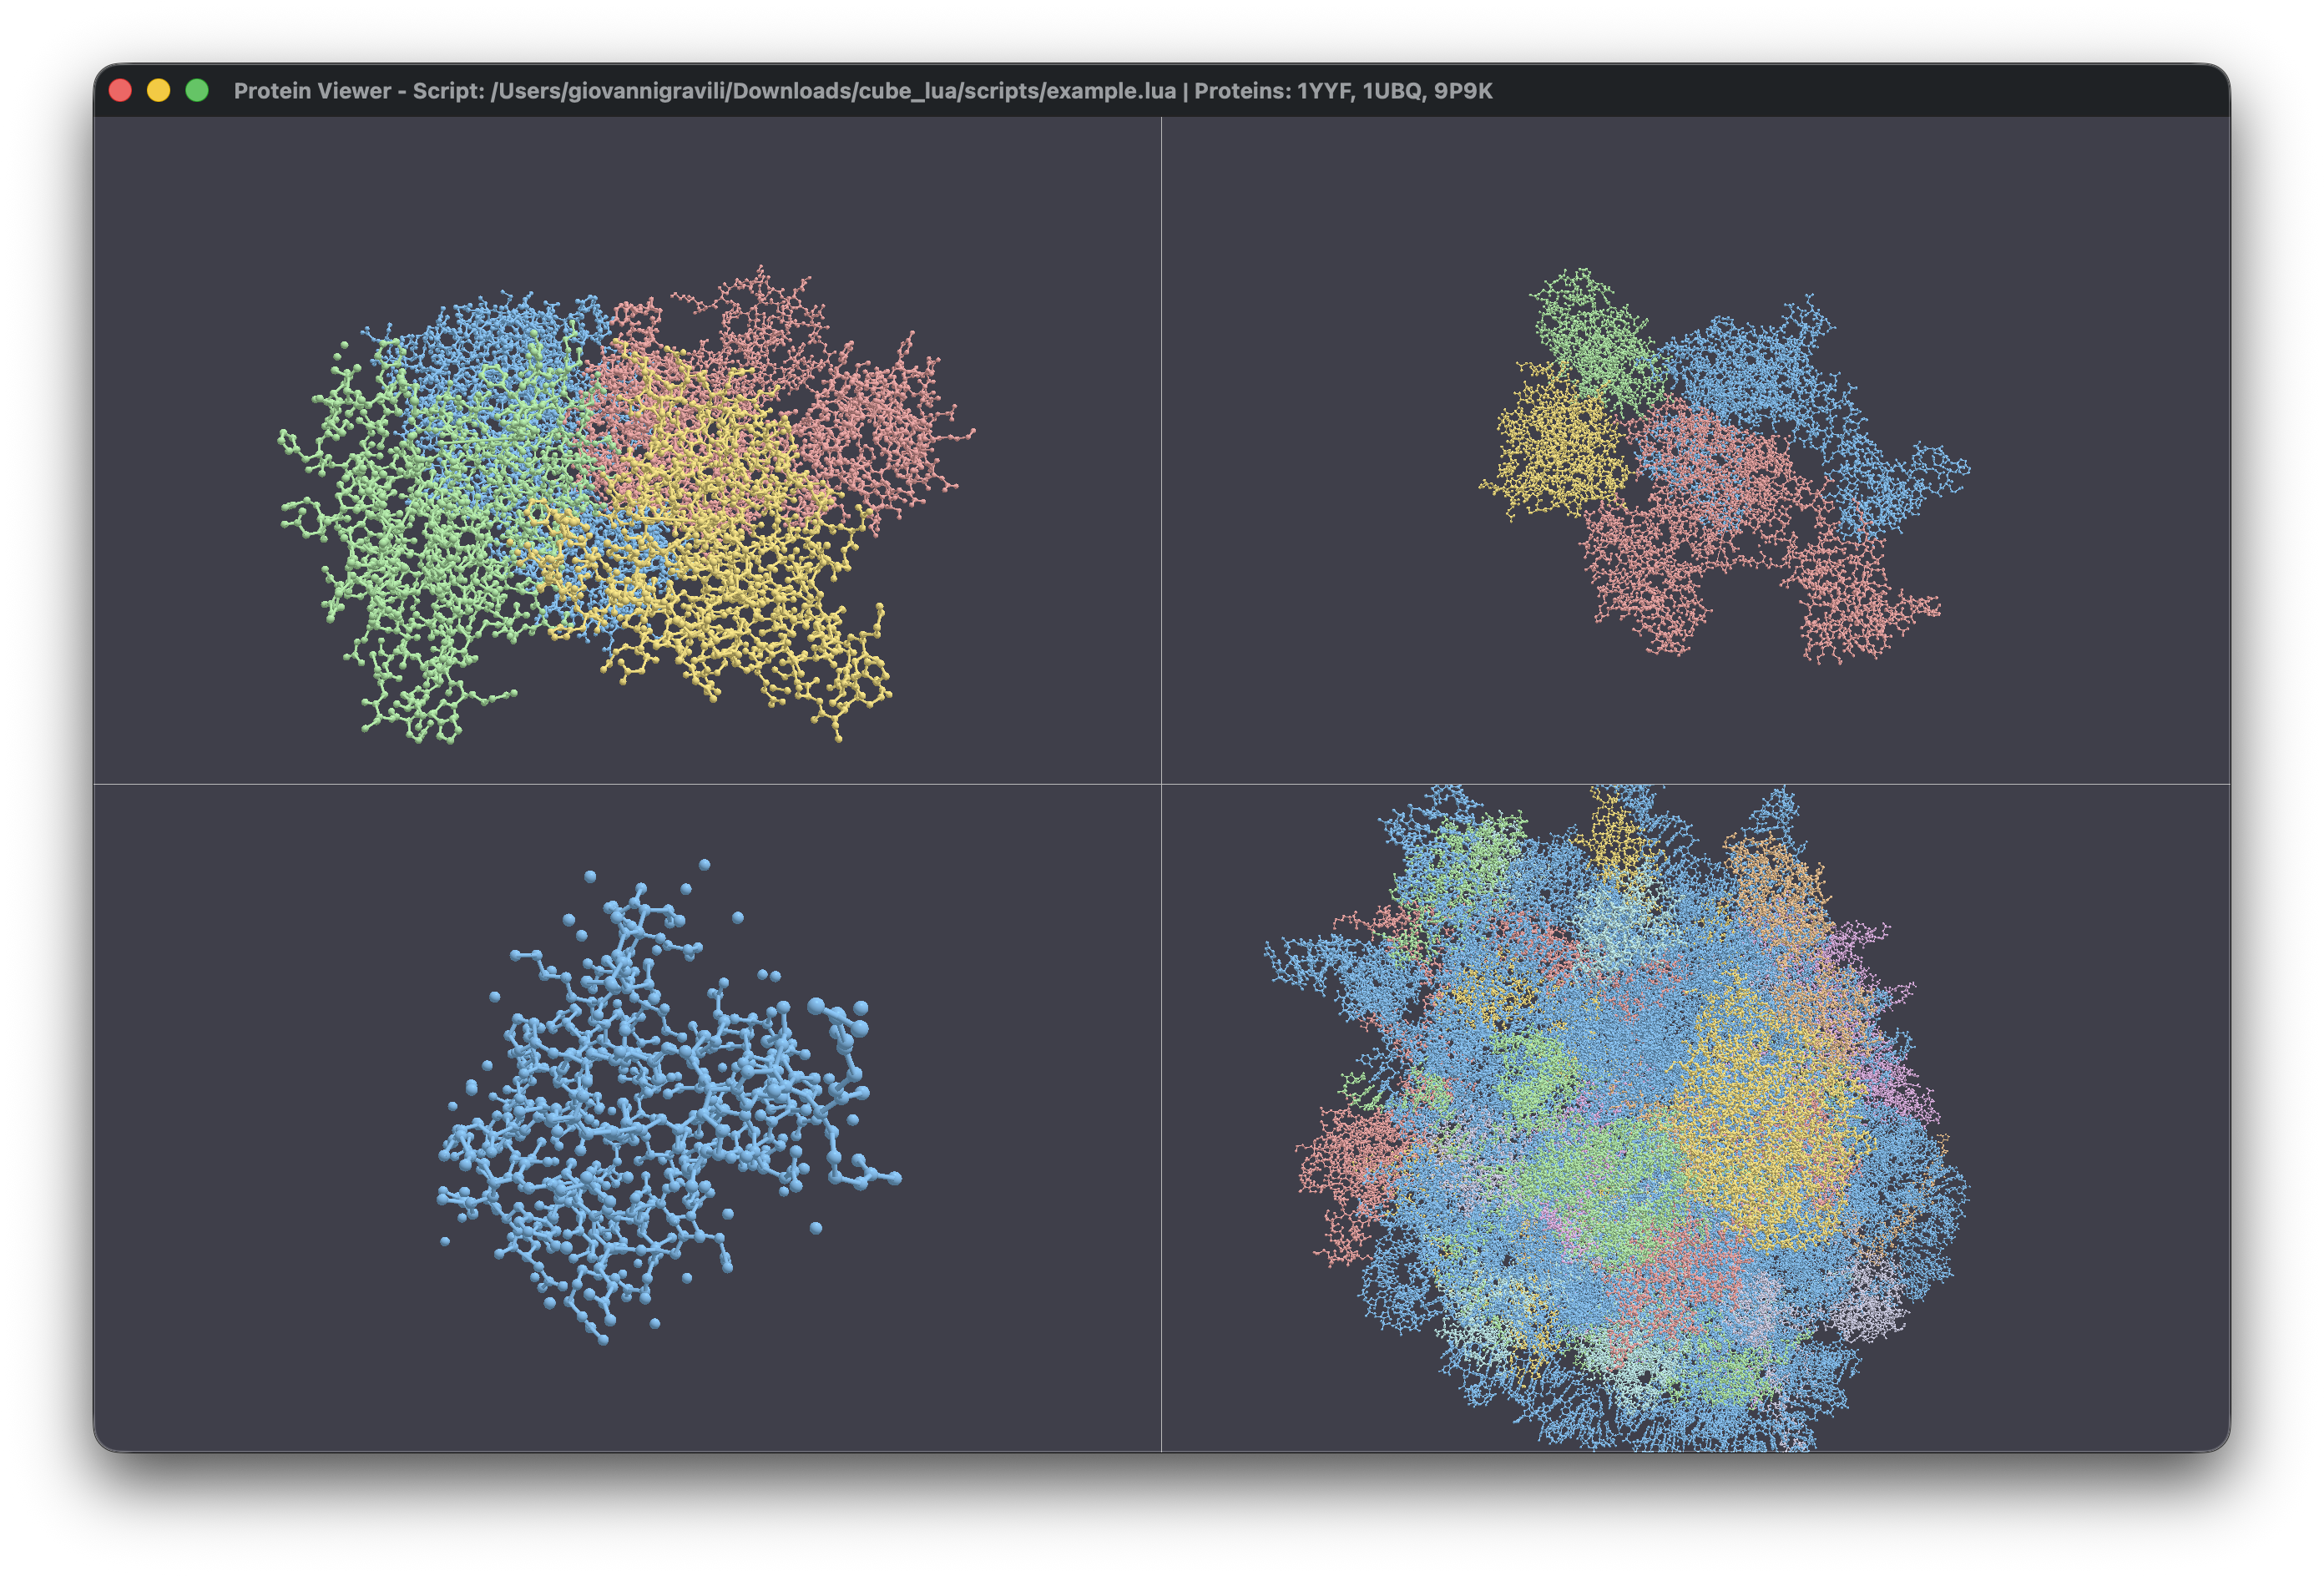
One of the core features is the ability to manage multiple viewports
in a single window. Unlike traditional viewers that force you into a
single instance, this toolkit uses a flexible grid system. You can load
an NMR structure with twenty different models and view them
side-by-side, each with its own camera and representation settings. This
is handled by a custom WindowState that manages a
collection of ViewportState objects, recalculating aspect
ratios and grid positions on the fly.
The rendering pipeline is implemented in WGSL, allowing the GPU to
handle the heavy lifting of drawing thousands of atoms. You can toggle
between several representation modes:
- Space-filling (VDW): Useful for understanding the
physical volume of the protein.
- Ball-and-Stick / Sticks: Ideal for examining
bonding patterns and active sites.
- Backbone / Lines: Simplifies the structure to focus
on the overall fold.
- Molecular Surfaces: Real-time generation of
solvent-excluded surfaces (SES) using a parallelized Marching Cubes
algorithm.
A Powerful Selection DSL
Navigating a protein with thousands of atoms requires a sophisticated
way to isolate what matters. I implemented a custom Domain Specific
Language (DSL) for atom selection. The parser takes queries and builds
an abstract syntax tree (AST), which is then evaluated against the
protein hierarchy.
The power of this system is best seen in spatial queries. For
example, in the example.lua script, I use a proximity
selection to find all atoms near Valine residues:
-- Complex spatial query: atoms within 5A of any Valine residue
local proximity_selection = reference_protein:select_atoms_by_query("within 5.0 of resn VAL")
print("Atoms within 5.0A of VAL residues: " .. proximity_selection:get_selected_atom_count())
You can also isolate structural features like helices or beta
sheets:
local helix_selection = reference_protein:select_atoms_by_query("helix")
local sheet_selection = reference_protein:select_atoms_by_query("sheet")
Scripting the Scientific
Workflow
The integration of Lua via the mlua crate transforms the
viewer into a programmable analysis platform. One of my favorite
features is the hot-reloading capability. Using the notify
crate, the application watches your Lua scripts for changes. The moment
you save your script, the toolkit clears the state and re-runs the code,
providing an instant feedback loop for developing complex analysis
pipelines.
A typical script can automate tasks that would take hours in a GUI,
such as aligning structures via the Kabsch algorithm:
-- Fetch structures from RCSB
local reference = pdb.fetch_protein_from_rcsb("1YYF")
local moving = pdb.fetch_protein_from_rcsb("1UBQ")

-- Select atoms for superposition
local query = "name CA and model 1"
local ref_sel = reference:select_atoms_by_query(query)
local moving_sel = moving:select_atoms_by_query(query)

-- Align structures using the Kabsch algorithm
moving:superimpose_onto_reference_structure(reference, moving_sel)

-- Calculate and report RMSD
local rmsd = moving:calculate_root_mean_square_deviation(reference, moving_sel)
print(string.format("Final Alignment RMSD: %.3f Å", rmsd))
Depth of Analysis and Data
Export
The toolkit isn’t just a pretty renderer; it’s a full-fledged
structural analysis suite. Beyond visualization, you can extract
quantitative data directly from the structures. In the example script, I
demonstrate how to calculate geometric centers, SASA, and even extract
specific sequences:
-- Protein Summary Data
local summary = reference_protein:get_summary_information()
print(string.format("Dimensions: %.1f x %.1f x %.1f A", summary.size.x, summary.size.y, summary.size.z))

-- SASA Calculation
local sasa_value = reference_protein:calculate_solvent_accessible_surface_area()
print("Total SASA: " .. string.format("%.2f", sasa_value) .. " A^2")

-- Distance between centroids of two selections
local sel1 = reference_protein:select_atoms_by_query("resi 1-10")
local sel2 = reference_protein:select_atoms_by_query("resi 20-30")
local dist = sel1:calculate_distance_to_other_selection(sel2)
Finally, the toolkit acts as a data bridge. It supports detecting
hydrogen bonds, salt bridges, and generating Ramachandran dihedral data
(
and
angles). All of this can be exported to standardized formats:
-- Data Export
reference_protein:export_analysis_report_to_json("analysis_report.json")
reference_protein:export_residue_data_to_csv("residues_data.csv")

-- FASTA Export
local fasta_data = reference_protein:generate_fasta_formatted_sequence()
By offloading the computational intensity to Rust and leveraging the
GPU for visualization, this project provides a high-performance
environment that bridges the gap between raw data and scientific
insight.